Investment Thesis
“If there is life, there is travel” - Barry Diller, Chairman of Expedia
Booking Holdings (BKNG 0.00%↑) is the largest online travel agency (OTA) in the world, as measured by room nights. The company manages marketplaces that connect supply (accommodation providers) with demand (travelers) more efficiently than would otherwise be possible. On top of a network effect, BKNG’s industry leading scale and a dynamic approach to marketing allows them to acquire customers cheaper than their competitors, which we believe leads to above-average margins and return on capital. We also believe that the global travel industry will continue to grow at an attractive rate for decades, and that BKNG is well positioned to benefit from that secular trend. The management team has executed on their strategy well, and their financial and operational track record reflect this. The one knock on the business is that they’ve accumulated a large negative net debt position, which is a drag on returns. On the flip side, they have an enviable balance sheet, and are well positioned to buy back a significant portion of their stock. The key drivers, in our view, are: take-rate, room nights, average daily revenue per room (ADR), and marketing spend. Our analysis suggests that the market is too pessimistic about the future of these key drivers, and thus BKNG shares are trading meaningfully below what we view to be fair value. Specifically, we think that the Google threat is exaggerated, and that macro concerns are too short-sighted. At US$1,950/share, we would buy BKNG today.
Value Proposition
As a marketplace that has already reached scale, BKNG adds value to consumers by giving them a single place to search, filter, and place reservations across literally millions of accommodation options globally; both hotels and alternative accommodations. Consumers can access the marketplace from a desktop, or from an easy-to-use mobile application, which we think is compelling. Part of the value proposition is the convenience of accessing a one-stop shop from any of your devices. The other component, from a consumer perspective, is consistency in experience. As a consumer, you can lean on countless user reviews and the aggregated opinions to manage your own expectations, which helps reduce the problem of over-promising and under-delivering, and in our view, enhances the customer experience. Lastly, BKNG tracks user preferences to better match them with accommodation options, and provides other services like car rentals, airline reservations, restaurant recommendations, and other experiences. In aggregate, they call these offerings the “connected trip”, and in our view these services reduce the friction of travel. In summary, BKNG is a great accommodation search tool with good filter options and instant booking capabilities, that delivers a consistent and relevant experience, and offers ancillary services aimed at reducing the friction of travel.
From the perspective of property owners, BKNG in particular, but OTAs in general, are cost effective distribution channels, particularly for smaller entities that can’t afford big marketing campaigns. By listing on a BKNG website, the property owner can instantly reach a massive global audience, and only has to pay BKNG when someone books a room. Some of the biggest hotel brands in the world, like Marriott, have such exceptional brand awareness and scale that they don’t need to lean on BKNG as an important distribution channel. The same can’t be said for most hotel businesses. BKNG also offers some software and payment services to property owners, which supplements the primary distribution channel value.
For providing this value, BKNG charges hotels a take-rate, which is a fee on the value of total bookings; the product of room nights and average revenue per night (ADR). BKNG’s take-rate has been consistently in the range of ~14-15%.
Competitive Advantage
In our view, BKNG benefits from two primary dynamics: a network effect and economies of scale.
First, the network effect. From the perspective of the property owner, the value of the distribution channel increases as more property owners join the platform. If Booking.com only had 100 properties, it wouldn’t be enticing to consumers as a convenient place to search and filter for accommodations. It becomes a little more enticing every time a new property is added, particularly as the number of different geographies and types of accommodations grow. As it becomes more enticing, more consumers use it, which helps drive traffic to hotels on the platform, increasing the value of the distribution channel. From a consumer perspective, the same is true. As more people use the platform, it becomes a more compelling distribution channel for property owners, and so more will list their properties, which increases the value to the consumer.
Unfortunately for BKNG, property owners can use multiple distribution channels, which means they can use multiple OTAs, and we tend to see a lot of the same properties on both the Expedia and Booking platforms. As a consumer, it really shouldn’t matter if we book a specific hotel through Expedia or Booking, so the product is ultimately homogeneous. With this in mind, the network effect is important for warding off new entrants, but not a major source of differentiation, in our view, between the big platforms.
What we believe sets BKNG apart from their OTA competitors, at least today, is their economies of scale. In the OTA space, customer acquisition costs are by far the single biggest cost item, and the most important driver there is spending on marketing through search engines. As we understand it, Google auctions off search words, and the top search results are determined by some mix of the highest bidder for those search words and the most relevant result. BKNG paid nearly US$4.5 bln on marketing in 2018 (nearly 60% of their total expenses), making it one of Google’s largest customers, and helping them place at-or-near the top in hotel searches. As a result, they are more likely to get traffic to their site and generate reservations. They spread out that $4.5 bln cost over all the room nights booked on their system, which totaled about 760 mln in 2018. This is more than double the volume of Expedia at 352 mln room nights, which is their next largest OTA competitor. It’s not easy to compare spending, but we figure that Expedia spends almost as much in absolute dollars on search words as BKNG, and is also spending to attract flight traffic, implying that they spend more than twice as much per room night. The clear read-through for us is that BKNG margins should be notably higher than competitors, which they are.
EBIT margins at competitors like Expedia and Ctrip were only 6% and 8% respectively in 2018, vs. BKNG at 37%. Why is this important? Because, if either company wanted to take meaningful share from BKNG, they’d likely have to increase their marketing expense to show up higher in search results, and with margins as low as they are, the capacity for these competitors to do so is limited. Because of this, we believe that the scale dynamic creates a positive feedback loop whereby BKNG shows up at the top of search results, generates more room nights, and can therefore afford to pay more per keyword and continue to show up at the top of search results. It will be difficult to break the cycle, and we assume that BKNG will continue to enjoy reasonable take-rates and above-average margins in the future.
Lastly, we have anecdotal evidence to suggest that BKNG has a best-in-class marketing team, which allows them to be nimble when allocating marketing dollars. Management consistently talks about reliance on data to understand return on marketing investment dollars, and they constantly adjust how they allocate dollars to maximize that ROI. When their competitors, like Expedia, see margins squeezed on the back of lower ROI from marketing spend, BKNG never seems to see the same magnitude of pressure. While difficult to prove, we believe that BKNG has a culture/organizational edge over their competitors.
Industry
Positive Secular Travel Trends
It’s difficult to get our hands on good travel industry data over any long time horizon, particularly for accommodations. That being said, we’ve found what we believe to be a good enough proxy for global travel, despite its obvious flaws: the UN World Tourism Organization reports international tourist arrival data going back to 1980, which we’ve shown in Exhibit A. Growth in tourist arrivals has been pretty consistent through time (3.4-5.0% over any 10 year period). Part of our BKNG thesis is that growth in global tourism will continue at a similar pace through our 10-year forecast period, at worst, and for many decades to come, at best. This should be driven by the falling cost of travel in real terms, rising real incomes and a growing middle class globally, and increased globalization.
According to the International Air Transport Association (IATA), the real cost of air transport has fallen by more than 50% in the last twenty years (link), which has obviously contributed to travel growth. It’s not clear if that will continue into the future, but one reason we suspect it might is that load factors, which are synonymous with utilization, can probably still increase, which makes the industry more efficient. The U.S. Department of Transportation shows that load factors in the U.S. have steadily increased from ~72% in 2002 to a record 83% in 2019 (link). Global data from Statista shows something similar (link). Most forecasts we’ve come across suggest load factors have more room to increase, and we’ve stumbled across many examples of airlines with load factors in excess of 90%. There are lots of other reasons that we can expect the real cost of air travel to fall, like better fuel efficiency of engines, better plane construction, and improving navigation systems.
On a recent conference call, BKNG’s CEO also commented on how many new passports China has been issuing, which should probably be a leading indicator for outbound Chinese travel. The specific comment was that there were only 55 mln Chinese passports outstanding at the end of 2017, but that there were more than 120 mln outstanding at the end of 2018. That’s only 9% of the total Chinese population, but growing quickly. We look at other regions like India and note that a similarly small portion of the population has passports, at only 5% in 2016. In the fullness of time, as real incomes rise in these major population centers, we’d expect more people to travel outside of their home country. We note that 37% of Americans have passports, 58% of Canadians, and roughly 70% of Brits!
All told, we think it’s clear that there is a secular industry tailwind continuing to benefit companies in the global travel business, BKNG included. This should translate into low-to-mid single digit industry-wide room night growth, which is one of our key drivers.
Shift in Booking Method to Benefit the OTA
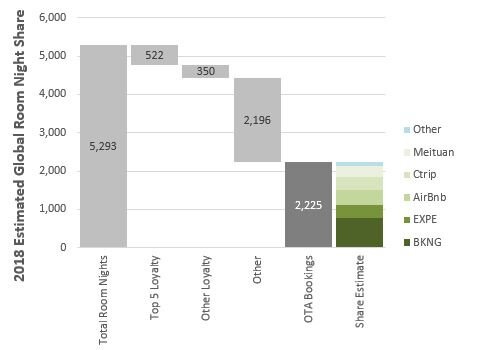
We estimate that slightly more than five billion room nights were booked in 2018, and we show a breakdown of which channels we think those bookings were made through in Exhibit B.
Big hotel brands have loyalty programs that incentivize travelers to book directly through the hotel instead of going to an OTA. The hotels do this to save on the 15% take-rate that OTA’s charge. Loyalty programs are effective with big brands like Marriott, but loyalty participation rates fall meaningfully as you move down the list to smaller brands like Hyatt. Nevertheless, we note that big brands are gaining market share, and loyalty program participation rates are growing. As a result, we expect bookings through loyalty programs to outpace growth in total industry room nights.
The “Other” bucket in Exhibit B is made up of primarily offline bookings, think: walk-ins, call centers, traditional travel advisers, group bookings, etc. In our view, there has been a secular shift for bookings to move from offline to online, and we expect it to continue. As an example, we talked to an industry expert who indicated that up to 70% of bookings are made on a walk-in basis for small budget hotels in the United States. It’s easier than ever for consumers to make that reservation on the fly from a mobile application, and we expect walk-in bookings to decrease as a result. We also note that more than 50% of BKNG’s room nights are reserved through their mobile channel, which would be up from nil just ten years ago. Given how many bookings are still made offline today, and our view that this will continue to shift online over time, we expect bookings through OTAs to grow faster than total industry-wide room nights. Exhibit C shows the expectations behind our base case for room nights booked by channel.
Average Daily Revenue (ADR) Headwinds
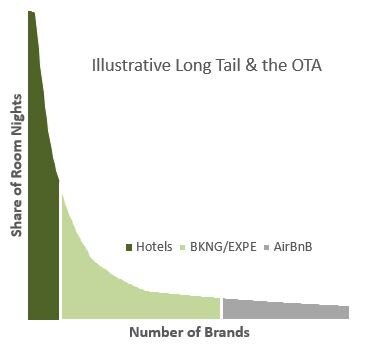
In our view, the global accommodation market seems to keep moving down the long tail, first with OTAs, and then with alternative accommodations. We illustrate this in Exhibit D. Shopping for and comparing accommodation options is easier today that it ever has been. Our working theory is that these accommodation marketplaces increased competition in the space, which probably weighed on ADRs. Marriott, which is the largest hotel brand in the world, has only seen an ADR CAGR of 1.7% from 2006-2018. Even if we pick the bottom of the financial crisis (lowest ADR) as a starting point, the CAGR for Marriot is only 2.4%. The average ADR growth rate over the last five years for major brands like Marriott, Hilton, and InterContinental, is even lower at sub-1%. We expect to see continued pressure on ADRs (one of our key drivers), such that they probably fail to keep up with inflation in the medium-term. In isolation, this isn’t ideal for OTA’s, which get paid a fee based on the value of bookings.
Dealing With Google
One bear thesis that seems to keep cropping up is that Google could decide to eat BKNG’s lunch. We think this is highly unlikely. We’ve been told that the OTA industry, particularly BKNG and EXPE, are some of Google’s biggest customers. For Google to eat their lunch, they’d be cannibalizing a massive revenue stream to chase another. They’d also have to hire tens of thousands of people globally to manage hotel relationships/on-boarding, customer service functions, and a number of other functions. It’s also fair to assume that Google would get sued or undergo some regulatory scrutiny from competing with their customers on their own platform. And even if this was all worth it, it’s not clear if Google would make more, less, or the same amount of revenue from the accommodation business as they earn from OTA advertising today. We say this, because the competitive response is likely to be fierce and drawn out from BKNG, EXPE, AirBnB, Ctrip, and so on. Considering Google still has a number of unmonetized platforms and other easy levers to pull for revenue growth, it just seems unlikely they’d risk pissing off some of their biggest customers, for an unknown payoff, with unpredictable risks.
What’s more likely is that Google becomes the meta-search engine to end all other meta-search engines, which helps them generate more search engine revenue without directly competing with the OTA in their core business. A good deal of BKNG/EXPE/AirBnB traffic today comes from the SEO (search engine optimization) channel, which is free. That being said, Google is increasingly directing traffic through paid channels like their hotel module, which means that marketing expenses should rise for the OTAs. This is a secular trend that we’ve already been witnessing for a long time (more paid, less free), and we expect it will continue. One way to combat the negative trend of rising marketing costs, is to drive more direct traffic. BKNG, in particular, is driving direct traffic through their mobile platform, and that channel continues to grow faster than the traditional search-engine channel. We expect that BKNG will continue to grow direct-bookings as a proportion of the total, and be nimble with marketing spending, such that their EBIT margins aren’t meaningfully impacted by rising Google fees. We note that in many parts of the world, many people that are accessing internet for the first time are skipping the desktop all together and going straight to mobile applications. This is one reason we expect the mobile channel to be an effective way of driving direct traffic.
Strategy
In our view, the BKNG strategy can be distilled down to three pillars:
Enhance the value of the current market place: offer the widest range of accommodation options (hotels and alternative accommodations), in the widest range of markets, at the most competitive prices, and through the widest range of devices. To expand the offering in new markets, BKNG will continue to invest in partnerships like they did with Didi and Grab. We think these are smart moves that should bear fruit in the medium-term. They will need to continue on-boarding new properties, make it easier to book through their own payment platform, and continue improving and promoting their mobile application. In our view, this has been a consistent part of the strategy for a long time, and management has done a good job at executing historically. We have every reason to believe they will continue to successfully execute in the future.
Enhance the consumer experience: on top of the primary accommodation business, BKNG continues to look for other value-added services it can provide consumers, for example: car rentals through Rentalcars.com, restaurant recommendations and reservation services through OpenTable, and unique experiences like surf lessons, art gallery tours, etc. It’s not immediately clear how successful they’ve been at executing on expanding the consumer experience, and in some instance it’s too early to tell, while in others the data seems mixed: BKNG purchased OpenTable for $2.6 bln in 2014, and then took a $940 mln goodwill impairment on the business in 2016 - clearly a blunder; on the other hand, they seem to be getting traction on rental cars and experiences. In our view, it’s important to experiment with these new services, but M&A doesn’t seem to be the right way to approach it. In our view, management seems to understand the perils of M&A, and in the last few years they’ve done very little. On balance, we remain skeptical about how this pillar will drive value for the business in the future.
Enhance the property-owner experience: BKNG has a division called BookingSuite that provides technology services to their travel partners. In our view, this is principally for small independent hotels and alternative accommodation providers, but it still makes up a big portion of their market. BookingSuite can give these independents tools to create their own website, optimize pricing, manage promotions, communicate with guests, facilitate on-line check-in, manage reservations, and much more. In our view, this makes BKNG an attractive place to list your property, which is integral to maintaining a deep accommodation marketplace.
Performance
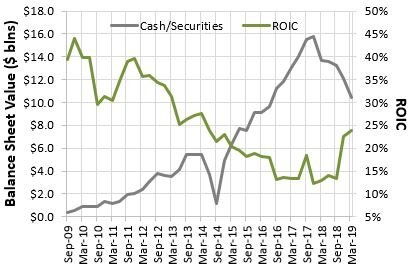
Historical performance has been exceptional, with EBIT, EPS, and BVPS all having grown at a mid-30% CAGR over the last decade. Historical ROIC has consistently exceeded their cost of capital, but the historical trend paints a bit of a disappointing picture, as shown in Exhibit E. From 2009 to 2018 ROIC consistently deteriorated from 40-45% to a low of only 12%. The primary reason for this was the massive accumulation of cash and investments on the balance sheet (also shown below) to almost $16 bln by the start of 2018. With the exception of some investments like the equity stake in Ctrip, the bulk of this accumulation had been sitting in cash or government securities, and in our view, was totally unproductive capital. In our view, if the company had returned that cash to shareholders, instead of accumulating it on the balance sheet, reported-ROIC would likely be somewhere in excess of 50% today. BKNG recently starting buying back their own stock, and drawing down on that liquidity, and subsequent ROIC has been rising rapidly, confirming that view. Our best guess suggests that incremental ROIC, adjusting for the cash build, has been somewhere in the 50-100% range for most of the last decade, and we suspect it will continue to be in that range well into the future.
Financial Position
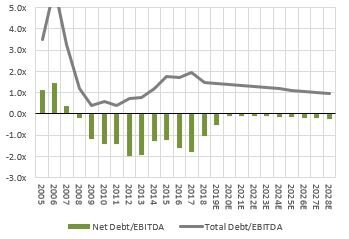
As a result of the aforementioned cash build, BKNG has had negative net debt/EBITDA for more than 10 years. In fact, at the end of 2017 net debt/EBITDA was almost -2.0x. BKNG bought back almost $6 bln of stock in 2018, and in the first three quarters of 2019 have purchased another $7 bln. The board has authorized up to an additional $12 bln in repurchases (~15% of float at time of writing), which the company expects to have completed in the next two years. In our view, they will fund the bulk of these buybacks with a draw down on cash and securities. Our best guess is that even after all of these buybacks, BKNG will still have modestly negative net debt/EBITDA by the end of 2021. Exhibit F shows historical leverage metrics and our expectations for the future.
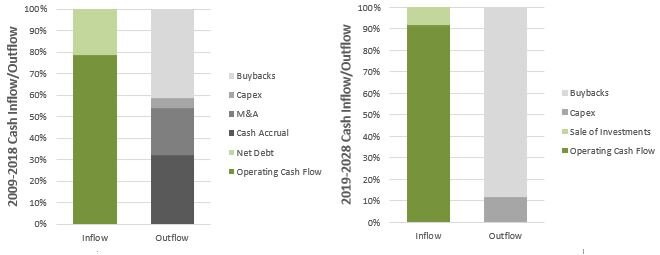
Part of what informs our forecast is the idea that BKNG will no longer accumulate excess cash on the balance sheet. History suggests that BKNG could probably have paid out about 85-90% of their operating cash flows, and if they had done so, net debt/EBITDA would be about zero today. This is only possible because the capital intensity of the business is so low, with PP&E as a percentage of revenue at only 4%. Given the recent pivot and willingness to meaningfully repurchase shares, we suspect that the board will continue to authorize repurchases programs and that BKNG will payout 85-90% of future operating cash flow. Exhibit G shows historical cash inflows/outflows vs. our forecast for the next decade.
In summary, BKNG has an enviable balance sheet today, where they can fund growth and repurchase a significant portion of their float on a consistent basis. We estimate that share buybacks could drive EPS growth of roughly 4-5% through the forecast period.
Management & Governance
Jeffery Boyd is currently the chairman of the board, and has been a board member since 2001. He joined the company in 2000, and was the CEO from 2002 to 2013, overseeing much of BKNG’s success. He was responsible for the acquisition of Booking.com, which many have argued is one of the best acquisitions of the last two decades, and has continued to play a key role in strategy formation, which we view positively. With more than US$100 mln of equity in the business, he is clearly aligned with shareholders.
When Boyd took a step back in 2013, he appointed Darren Huston as his replacement. Darren’s tenure was short-lived, and he was ousted in 2016 for violating company policy by having a relationship with a subordinate. This is clearly a check-mark in the “not great to see” column, but one that we think we can ignore. To replace Darren, the Board ultimately elected Glen Fogel as CEO, who had been with the company since 2000 as Head of Strategy. We like that Fogel and Boyd worked side-by-side, and note that the company strategy is largely unchanged under Fogel’s leadership. We view this positively. Fogel currently owns more than US$50 mln in BKNG stock, so is clearly all-in next to investors as well.
There have been a few changes in other leadership roles in recent years, with the bulk of those changes resulting in consolidation of responsibility under fewer people. For example, the CEO of Booking.com stepped down such that Fogel could run that core businesses in addition to his role as the Booking Holdings CEO. We think this makes sense, and note that the previous Booking.com CEO (Gillian Tans), is now the Chairman of the Booking.com Board, so is still helping advise on strategy. There are also some really interesting changes at the margin, like Booking.com poaching Arjan Dijk from Google this summer, where he was previously the VP of Global Marketing. This looks like a great addition, particularly considering the relationship between Booking and Google. All told, we think there are great people running and overseeing the organization today, many of whom have long tenures with the organization or have come from Booking’s competitors or service providers. We are also encouraged by the fact that when named executives leave the organization, it’s typically because they retire, not because they leave to work for competing organizations
One thing we worry about a little bit is that the board uses a rolling three-year EBITDA growth target as the primary performance measurement tool for determining management compensation, in particular for the CEO. For other named executive officers, they seem to place a greater emphasis on other factors, but the rolling three-year EBITDA growth metric is still a major component. There doesn’t appear to be any reference to a return on capital metric, and that might explain why cash was allowed to accumulate to such a massive level, resulting in continuously falling corporate ROIC. If management had also been compensated based on ROIC, we might have seen major share repurchases start years ago. Considering the crazy appreciation in stock price, BKNG probably could have repurchased two or three times as much stock if they had started the buyback program years ago instead of letting that cash accumulate.
Despite our concerns about the metrics used to compensate management, we note that the board collectively owns $140 mln of equity, and that EBITDA growth isn’t the worst measuring stick to use (they adjust out the impact of M&A, so that the company can’t just purchase growth for growth’s sake). With so much personally invested, it’s unusual they let so much unproductive capital accumulate on the balance sheet. One explanation might have been that they were saving up for a big acquisition, whereby incremental ROIC might have been quiet large, and compensated for the cash drag in all the years prior. OpenTable may have been the first of many intended targets, but the relative failure of that acquisition may have given the board/management second thoughts about M&A, hence the large eventual share repurchases and focus on organic growth. This theory seems to fit the sequence of actions taken by the company, and if true, shows capital discipline.
Overall, we like the management team at BKNG, and hold the view that the c-suite and board is reasonably aligned with shareholders. We think we can wrap our head around the one red flag we’ve highlighted above.
Valuation & Scenarios
The four key drivers of valuation in our model are room night growth, take rate, average daily revenue (ADR), and marketing spending. Our forecasts are shown in Exhibit H, along with a screenshot of our DCF calculation.
In our view, take-rates are likely to fall modestly from current levels as BKNG expands into lower take-rate regions like North America and Asia. Our forecast reflects this, despite the fact that the company’s take-rate has actually remained remarkably stable in the past. We also assume that BKNG’s room night growth will be in-line with the industry average, implying no additional market share gains. This seems fair given that we don’t have any meaningful EBITDA margin compression in the future, which you might expect to see if BKNG made an aggressive market-share push. Lastly, we have ADRs growing at only 0.25%/year to reflect normal inflation, offset by growth in low-ADR regions and the deflationary impact of growing alternative accommodations.
Our base case implies fair value around $2,750/share, which is roughly 40% above the current share price. We also show a summary of our bear/bull cases in Exhibit I, and we note that our bear case target of $1,700/share is only 14% below the current stock price. Our analysis suggests risk is meaningfully skewed to the upside.
We estimate that the current stock price implies EBITDA growth from 2018 to 2028 of slightly more than 1%, and EPS growth over the same period of only 6.5-7.0% vs. our 11.0% base case. In our view, the market is especially concerned about Google, and has much lower expectations for EBITDA margins and room night growth than we do. It’s also likely that the market is expressing concerns about the possibility of a recession into the current share price, which we believe is overblown and transient. In aggregate, we have fairly high confidence that the business is undervalued.
What would The 10th Man say?
We try to capture this view in our bear case. In this scenario, Google extracts a significantly greater amount of money from their paid search channels, such that EBITDA margins for BKNG fall to just 25% (margins haven’t been that low since 2007). Google also offers an effective meta-search engine and makes it easier for consumers to book directly through the hotel, which puts more downward pressure on take-rates. We’ll call this the perfect-Google-storm. In this scenario, some of BKNG’s competitors lose meaningful market share, because they don’t have the same ability to absorb lower margins and take rates. As a result, BKNG room night growth is actually higher than the base case, even if we assume industry room night growth slows down. Unfortunately, much of the share gain is in low-ADR markets, so ADRs actually shrink from current levels.


